Auto Added by WPeMatico

No Comments

Is Wall Street Buying Up All the Homes in America?

If you’re thinking about buying a home, you may find yourself interested in the latest real estate headlines so you can have a pulse on all of the things that could impact your decision. If that’s the case, you’ve probably heard mention of investors, and wondered how they’re impacting the housing market right now. That could leave you asking yourself questions like:

  • How many homes do investors own?
  • Are institutional investors, like large Wall Street Firms, really buying up so many homes that the average person can’t find one?

To answer those questions, here’s the real story of what’s happening based on the data.  

Let’s start with establishing how many single-family homes (SFHs) there are and what portion of those are rentals owned by investors. According to SFR Investor, which studies the single-family rental market in the United States, there are eighty-two million single-family homes in this country. But how many of them are actually rentals?

According to data shared in a recent post, sixty-eight million (82.93%) of those homes are owner-occupied – meaning the person who owns the home lives in it. If you subtract that sixty-eight million from the total number of single-family homes (82 million), that leaves just about fourteen million homes left that are single-family rentals (SFRs).

Do institutional investors own all of those remaining fourteen million homes? Not even close. Let’s take it one step further. There are four categories of investors:

  • The mom & pop investor who owns between 1-9 SFRs
  • The regional investor who owns between 10-99 SFRs
  • Smaller national investor who owns between 100-999 SFRs
  • The institutional investor who owns over 1,000 SFRs

These categories show that not all investors are large institutional investors. To help convey that even more clearly, here are the percentages of rental homes owned by each type of investor (see chart below):


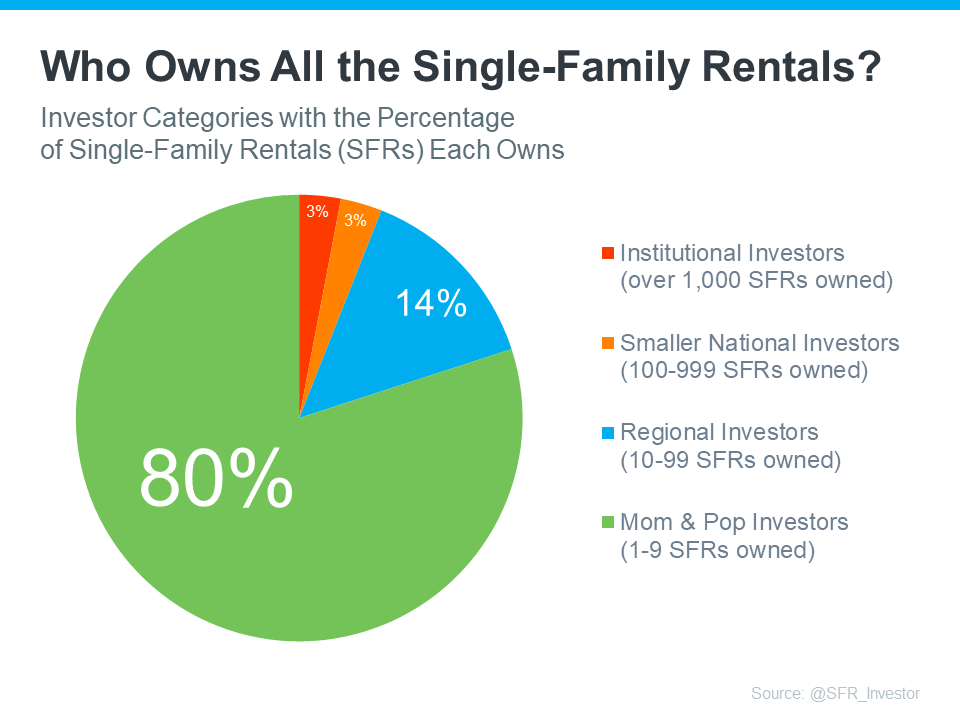
As you can see in the chart, despite what the news and social media would have you believe, the green shows the vast majority are not owned by large institutional investors. Instead, most are owned by small mom & pop investors, like your friends and neighbors.

What’s actually happening is, that there are people out there, just like you, who believe in homeownership, and they view buying a home (or a second home) as an investment. Maybe they saw an opportunity to buy a second home over the last few years to use it as a rental and generate additional income. Or maybe they just decided to keep their first house rather than sell it when they moved up.

So, don’t believe everything you read or hear about institutional investors. They aren’t buying up all the homes and making it impossible for the average person to buy. That’s just not what the numbers show. Institutional investors are actually the smallest piece of the pie chart.

Bottom Line

While it’s true that institutional investors are a player in the single-family rental marketplace, they’re not buying up all of the houses on the market. If you have other questions about things you’re hearing about the housing market, connect with a trusted real estate professional so you have an expert to give you the context you need.

No Comments

Home Prices Still Growing – Just at a More Normal Pace

If you’re feeling a bit muddy on what’s happening with home prices, that’s no surprise. Some people are still saying prices are falling, even though data proves otherwise. Part of that misconception is because people are getting their information from unreliable sources. But it’s also coming from some media coverage misrepresenting what the data really shows.

So, to keep things simple, here’s what you really need to know using real data you can trust.

Normal Home Price Seasonality Explained

In the housing market, there are predictable ebbs and flows that happen each year. It’s called seasonality. Spring is the peak homebuying season when the market is most active. That activity is typically still strong in the summer but begins to wane as the cooler months approach.

Home prices follow along with seasonality because prices appreciate most when something is in high demand. That’s why there’s a reliable long-term home price trend. The graph below uses data from Case-Shiller to show the typical percent change for monthly home price movement from 1973 through 2022 (not adjusted, so you can see the seasonality):


As the data shows, at the beginning of the year, home prices grow, but not as much as they do when entering the spring and summer markets. That’s because the market is less active in January and February since fewer people move in the cooler months. As the market transitions into the peak homebuying season in the spring, activity ramps up, and home prices go up a lot more in response. Then, as fall and winter approach, prices still grow, just at a slower pace as activity eases again.

This Year, Seasonality Has Returned

Now, let’s look at how this year compares to that long-term trend (see graph below):


Here’s the latest data for this year from that same source. Just like before, the dark bars are the long-standing trend. The green bars represent what’s happened this year. As you can see, the green bars are beginning to fall in line with what’s normal for the market. That’s a good thing because it’s more sustainable price growth than we’ve seen in recent years.

In a nutshell, nationally prices aren’t falling, it’s just that price growth is beginning to normalize. Moving forward, there’s a chance the media will misrepresent this slowing of home price growth as prices falling. So don’t believe everything you see in the headlines. The data included here gives you the context you need to really understand what’s happening. So, if you see something in the headlines that’s confusing, don’t just take it at face value. Ask a trusted real estate professional for more information.

Remember, it’s normal to see home price growth slow down as the year goes on. And that definitely doesn’t mean home prices are falling. They’re just rising at a more moderate pace.

Bottom Line

Home price appreciation is returning to normal seasonality and that’s a good thing. If you have questions about what’s happening with prices in your local area, connect with a real estate professional.

No Comments

Are There Actually More Homes for Sale Right Now?

If you’re looking to make a move, you want to be sure you have the latest information on the housing market. To help make that possible, here’s an update on the supply of homes for sale today. Whether you’re looking to buy or sell, the number of homes available in your local market matters to you. Take a look below.  

What’s the Truth About Today’s Housing Inventory?

While the story for the past few years has been how few homes are on the market, recent national data may leave you feeling a bit confused. That’s because Realtor.com shows inventory is actually growing a bit month-over-month in many parts of the country (see the blue states in the map below):

As the map shows, nationally, housing supply increased just over 5% last month.

Does That Mean the Days of Limited Inventory Are Over?

That might make you wonder: are the days of tight housing supply behind us? The short answer is no. Context is important. While you may see headlines saying inventory is up, data also shows there are still significantly fewer homes for sale than there would usually be in a more normal market.

The graph below compares the latest active listing counts (homes currently available for sale) with the most recent normal years in the housing market (2017-2019):

As Lance Lambert, Founder, ResiClub Analytics, explains:

Housing market inventory is so far below pre-pandemic levels that October’s big jump is still just a drop in the bucket.”

What does that mean for you? Remember, real estate is hyper-local. Partnering with a trusted real estate agent will help you gain a better understanding of the inventory situation in your specific market.

If you’re looking to buy, you may have slightly more options than you did in recent months, but you still need to brace for low inventory. A great agent will be able to share their expertise and key strategies that have helped other buyers navigate today’s ongoing low housing supply.

And, if you’re trying to sell, rest assured you haven’t missed your window of opportunity to potentially get multiple offers or see your house sell quickly. While inventory has ticked up some nationally, overall, it’s still low and may be down even more in your area. 

Bottom Line

If you’re looking to buy or sell a home, connect with a local real estate agent so you can make sure you’re up to date on all the latest trends that could impact your move, including today’s housing supply. 

No Comments

2024 Housing Market Forecast [INFOGRAPHIC]

Some Highlights

No Comments

People Are Still Moving, Even with Today’s Affordability Challenges

If you’re thinking about buying or selling a home, you might have heard that it’s tough right now because mortgage rates are higher than they’ve been over the past few years, and home prices are rising. That much is true. Take a look at the graph below. It breaks down how the current affordability situation stacks up to recent years.


The National Association of Realtors (NAR) explains how to read the values on the graph:

“To interpret the indices, a value of 100 means that a family with the median income has exactly enough income to qualify for a mortgage on a median-priced home.”

The black dotted line represents that 100 value on the index. Essentially, the higher the bar, the more affordable homes are. As you can see, the orange bar for today shows higher mortgage rates and home prices have created a clear challenge. But, while affordability is definitely tighter right now, that doesn’t mean the housing market is at a standstill.

According to NAR, based on the pace of sales right now, just under 4 million homes will sell this year. With some simple math, let’s break down what that really means for you:

  • 3.96 million homes divided by 365 days in a year = 10,849 houses sell each day
  • 10,849 divided by 24 hours in a day = 452 houses sell per hour
  • 452 divided by 60 minutes in an hour = about 8 houses sell each minute

So, on average, over 10,000 homes sell each day in this country. Whether you’re a buyer or a seller, this goes to show there are still ways to make your move possible, even at a time when affordability is tight.

An Agent Can Help You Make Your Move a Reality

You may be wondering how other homebuyers and sellers are making this happen now. One of the biggest game-changers in today’s market is working with a trusted local real estate agent. Great agents are helping other people just like you navigate today’s market and the current affordability situation, and their insight is invaluable right now.

True professionals will be able to offer advice tailored to your specific wants, needs, budget, and more. Not to mention, they’ll also be able to draw on their experience of what’s working for other buyers and sellers right now. This could mean broadening your search, if needed, to include other housing types like condos, townhouses, or neighborhoods a bit further out to help offset some of the affordability challenges today. 

Bottom Line

You might think there aren’t many people buying or selling homes right now since affordability is tighter than it’s been in quite some time, but that’s not the case. It’s true that buying a home has become more expensive over the past couple of years, but people are still moving.


If you’re hoping to buy or sell a home today, know that other people are still making their goals a reality – and that’s happening in large part because of the help and advice of skilled real estate agents. Want to talk to a trusted professional about your own move? Connect with a local real estate agent.  

No Comments

The Latest 2024 Housing Market Forecast

The new year is right around the corner, and you might be wondering if 2024 will be the right time to buy or sell a home. If you want to make the most informed decision possible, it’s important to know what the experts have to say about what’s ahead for the housing market. Spoiler alert: the projections may be better than you think. Here’s why.

Experts Forecast Ongoing Home Price Appreciation

Take a look at the latest home price forecasts from Fannie Mae, the Mortgage Bankers Association (MBA), and the National Association of Realtors (NAR):


As you can see in the orange bars on the left, on average, experts forecast prices will end this year up about 2.8% overall, and increase by another 1.5% by the end of 2024. That’s big news, considering so many people thought prices would crash this year. The truth is, prices didn’t come tumbling way down in 2023, and that’s because there just weren’t enough homes for sale compared to the number of people who wanted or needed to buy them, and that inventory crunch is still very real. This is the general rule of supply and demand, and it continues to put upward pressure on prices as we move into the new year.

Looking forward, experts project home prices will continue to rise next year, but not quite as much as they did this year. Even though the expected rise in 2024 isn’t as big as in 2023, it’s important to understand home price appreciation is cumulative. In simpler terms, this means if the experts are right, according to the national average, after your home’s value goes up by 2.8% this year, it should go up by another 1.5% next year. That ongoing price growth is a big part of why owning a home can be a smart decision in the long run.

Projections Show Sales Should Increase Slightly Next Year

While 2023 hasn’t seen a lot of home sales relative to more normal years in the housing market, experts are forecasting a bit more activity next year. Here’s what those same three organizations project for the rest of this year, and in 2024 (see graph below):


While expectations are for just a slight uptick in total sales, improved activity next year is a good thing for the housing market, and for buyers and sellers like you. As people continue to move, that opens up options for hopeful buyers who are looking for a home.

So, what do these forecasts show? The housing market is expected to be more active in 2024. That may be in part because there will always be people who need to move. People will get new jobs, have children, get married or divorced – these and other major life changes lead people to move regardless of housing market conditions. That will remain true next year, and for years to come. And if mortgage rates come down, we’ll see even more activity in the housing market.

Bottom Line

If you’re thinking about buying or selling, it’s important to know what the experts are forecasting for the future of the housing market. When you’re in the know about what’s ahead, you can make the most informed decision possible. Connect with a local real estate agent to chat about the latest forecasts, and craft a plan for your next move.

No Comments

These Top Cities Show Home Prices Are Still Climbing

If you’re considering buying a home or selling your current one to find something that better suits your needs, you may have questions about what’s happening with home prices today. Here’s what you need to know.

There’s still a lot of confusion and misinformation out there. So, no matter what you may have heard, the national data shows they’ve actually been climbing again (see graphs below):


As you can see, in the first half of 2022, home prices went way up. Those increases were dramatic and unsustainable. So, in the second half of 2022, prices adjusted. Those dips were small and didn’t last very long. Still, the news made a big deal about these slight declines, which may have made you worry.

But what’s important to know is that, in 2023, prices are going up again, and this time it’s at a more normal pace. The fact that all three reports now show more typical price increases this year is good news for the housing market.

Home Prices Are Rising Across the Top Cities in the U.S.

After seeing steady home price growth at the national level for the last several months, you may wonder if prices are going up in your local area, too. Know this: while this will vary from one area to the next, home prices are appreciating in these top cities Case-Shiller reports on in their monthly price index (see chart below):


That’s why so many experts are able to forecast home prices will end the year in the positive and continue going up in 2024.

Here’s How This Affects You

  • For Buyers: If you’ve been waiting to buy a home because you were concerned it might lose value, the fact that home prices are going up should ease your worries. Buying a home before prices climb higher can be a smart move since home values typically appreciate over time.
  • For Sellers: If you’ve been postponing selling your house because you were worried about how changing home prices would affect its value, now might be a good time to work with a real estate agent to put your house on the market. You don’t have to wait any longer because the data shows home prices are in your favor.

Bottom Line

If you delayed moving because you were concerned home prices could drop, don’t worry – the numbers show they’re going up nationally. To better understand how home prices are changing in your neighborhood, team up with a local real estate agent.

No Comments

Homeowner Net Worth Has Skyrocketed

If you’re weighing your options to decide whether it makes more sense to rent or buy a home today, here’s one key data point that could help you feel more confident in making your decision. Every three years, the Federal Reserve Board releases the Survey of Consumer Finances (SCF). That report covers the difference in net worth for both homeowners and renters. Spoiler alert: the gap between the two is significant.

The average homeowner’s net worth is almost 40X greater than a renter’s. And here’s the data to prove it (see graph below):

The Big Reason Homeowner Net Worth Is So High

In the previous version of that report, the net worth of the average homeowner was roughly $255,000 and that of the average renter was $6,300. But in the release that just came out this year, the gap widened as homeowner net worth climbed dramatically. As the Survey of Consumer Finances (SCF) report says:

“. . . the 2019-2022 growth in median net worth was the largest three-year increase over the history of the modern SCF, more than double the next-largest one on record.”

One of the biggest reasons homeowner net worth skyrocketed is home equity.

Over the last few years, known as the ‘unicorn’ years for housing, home prices went through the roof. That’s because there weren’t enough homes for sale, and there was a big influx of buyers rushing to buy them and take advantage of the then record-low mortgage rates. That imbalance of supply and demand pushed prices higher and higher. As a result, most homeowners who had a home during that time saw their equity grow a lot.

If you’re still in the middle of making your decision on whether to rent or buy, you may wonder if you missed the boat on the big net worth boost. But here’s what you need to realize. As a recent article in The Ascent explains:

Whether your net worth increased in recent years or not, there are steps you can take to boost that number in the coming years. . . buying a home can be a great way to grow your net worth, since home values have a tendency to rise over time.”

Historically, home prices climb over time. Even now that mortgage rates are closer to 7-8%, prices are still rising in many areas of the country because supply is still low compared to demand. That’s why expert forecasts for the next few years call for ongoing appreciation – just at a pace that’s more typical for the housing market.

While it likely won’t be the record ramp-up that happened over the last few years, people who buy now should continue to grow equity in the years ahead. That means, if you’re ready and able to buy a home today, you’ll be making an investment that’ll help build your net worth in the long run.

As Jessica Lautz, Deputy Chief Economist at the National Association of Realtors (NAR), says:

“. . . when deciding to rent vs buy, one must calculate the total cost of homeownership (maintenance, utilities, commuting, etc.) and the total financial benefit. Based on new Fed data . . . the median net worth of homeowners was $396,200 vs renters at $10,400. There is no question about the wealth gains that homeownership provides.”

Bottom Line

If you’re on the fence about whether to rent or buy a home, remember that homeownership can give your net worth a big boost over time. If you want to learn more about this or the many other benefits of owning a home, connect with a local real estate agent.

No Comments

Don’t Believe Everything You Read About Home Prices

According to the latest data from Fannie Mae, 23% of Americans still think home prices will go down over the next twelve months. But why do roughly 1 in 4 people feel that way?

It has a lot to do with all the negative talk about home prices over the past year. Since late 2022, the media has created a lot of fear about a price crash and those concerns are still lingering. You may be hearing people in your own life saying they’re worried about home prices or see on social media that some influencers are saying prices are going to come tumbling down.

If you’re someone who still thinks prices are going to fall, ask yourself this: Which is a more reliable place to get your information – clickbait headlines and social media or a trusted expert on the housing market?

The answer is simple. Listen to the professionals who specialize in residential real estate.

Here’s the latest data you can actually trust. Housing market experts acknowledge that nationally, prices did dip down slightly late last year, but that was short-lived. Data shows prices have already rebounded this year after that slight decline in 2022 (see graph below):

But it’s not just Fannie Mae that’s reporting this bounce back. Experts from across the industry are showing it in their data too. And that’s why so many forecasts now project home prices will net positive this year – not negative. The graph below helps prove this point with the latest forecasts from each organization:


What’s worth noting is that, just a few short weeks ago, the Fannie Mae forecast was for 3.9% appreciation in 2023. In the forecast that just came out, that projection was updated from 3.9% to 6.7% for the year. This increase goes to show just how confident experts are that home prices will net positive this year.

So, if you believe home prices are falling, it may be time to get your insights from the experts instead – and they’re saying prices aren’t falling, they’re climbing.

Bottom Line

There’s been a lot of misleading information about home prices over the past year. And that’s still having an impact on how people are feeling about the housing market today. But it’s best not to believe everything you hear or read.


If you want information you can trust, turn to the real estate experts. Their data shows home prices are on the way back up and will net positive for the year. If you have questions about what’s happening in your area, connect with a local real estate agent. 

No Comments

Foreclosures and Bankruptcies Won’t Crash the Housing Market

If you’ve been following the news recently, you might have seen articles about an increase in foreclosures and bankruptcies. That could be making you feel uneasy, especially if you’re thinking about buying or selling a house.

But the truth is, even though the numbers are going up, the data shows the housing market isn’t headed for a crisis.

Foreclosure Activity Rising, but Less Than Headlines Suggest

In recent years, the number of foreclosures has been very low. That’s because, in 2020 and 2021, the forbearance program and other relief options were put in place to help many homeowners stay in their homes during that tough time.

When the moratorium ended, there was an expected rise in foreclosures. But just because they’re up, that doesn’t mean the housing market is in trouble.

To help you see how much things have changed since the housing crash in 2008, check out the graph below using research from ATTOM, a property data provider. It looks at properties with a foreclosure filing going all the way back to 2005 to show that there have been fewer foreclosures since the crash.

As you can see, foreclosure filings are inching back up to pre-pandemic numbers, but they’re still way lower than when the housing market crashed in 2008. And today, the tremendous amount of equity American homeowners have in their homes can help people sell and avoid foreclosure.

The Increase in Bankruptcies Isn’t Dramatic Either

As you can see below, the financial trouble many industries and small businesses felt during the pandemic didn’t cause a dramatic increase in bankruptcies. Still, the number of bankruptcies has gone up slightly since last year, nearly returning to 2021 levels. But that isn’t cause for alarm.

The numbers for 2021 and 2022 were lower than more typical years. That’s in part because the government provided trillions of dollars in aid to individuals and businesses during the pandemic. So, let’s instead focus on the bar for this year and compare it to the bar on the far left (2019). It shows the number of bankruptcies today is still nowhere near where it was before the pandemic. Both of these two factors are reasons why the housing market isn’t in danger of crashing.

Bottom Line

Right now, it’s crucial to understand the data. Foreclosures and bankruptcies are rising, but these leading indicators aren’t signaling trouble that would cause another crash.